Easy Plotting
import procastro
Before starting any plot, either as part of a custom axes array or standalone, you can call figaxes() that accepts a variety of inputs and always return a figure and a single axes. It is very useful to use inside a plotting function that doesn’t need to care much about the input axes.
# without argument, it creates a new figure
f, ax = pa.figaxes()

# if given an integer or a figure, it creates/reuses the specified figure
f, ax = pa.figaxes(1)

# if given an axes, it returns that axes along with the hosting figure
f, ax = pa.figaxes(axes)
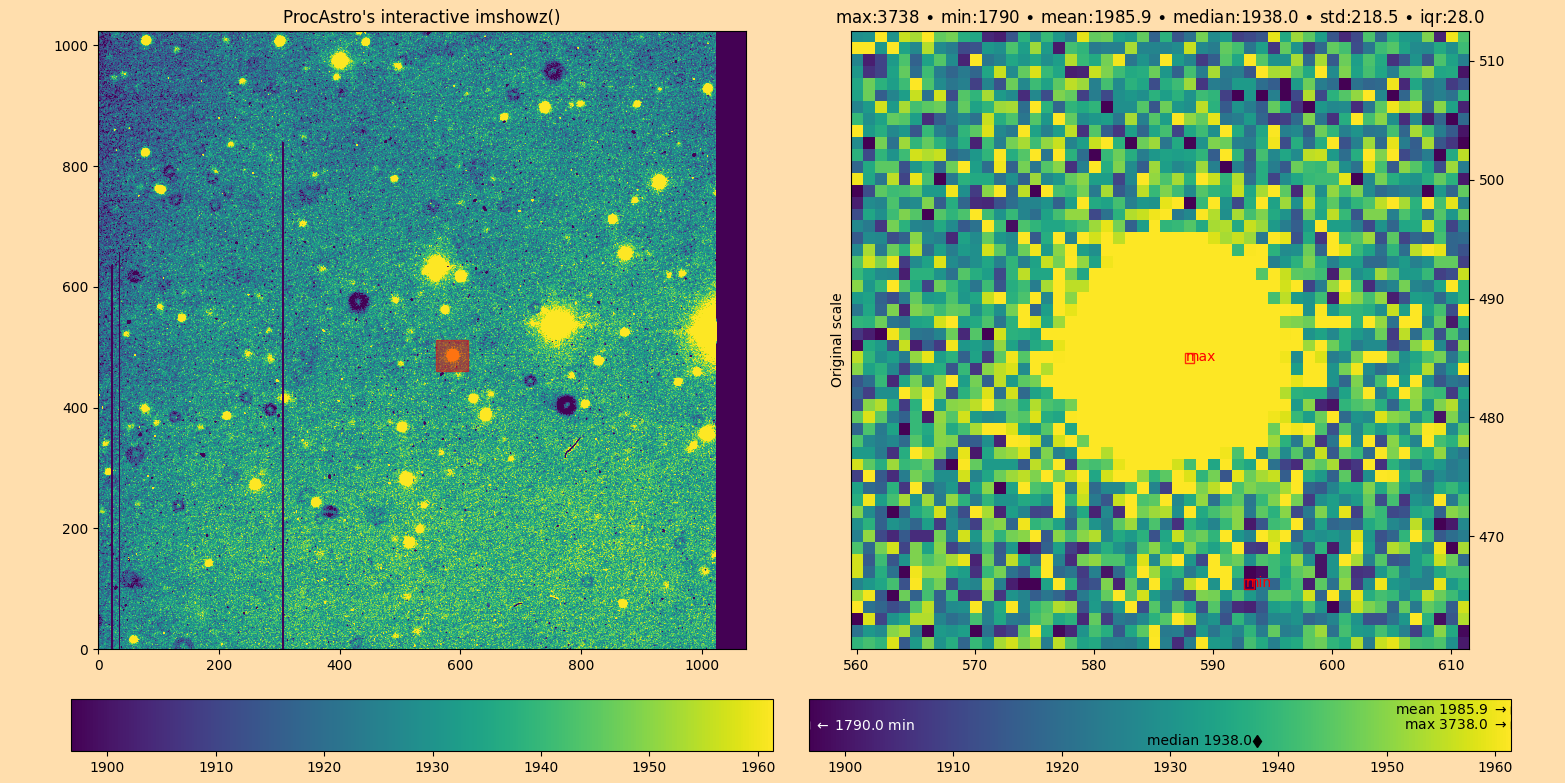
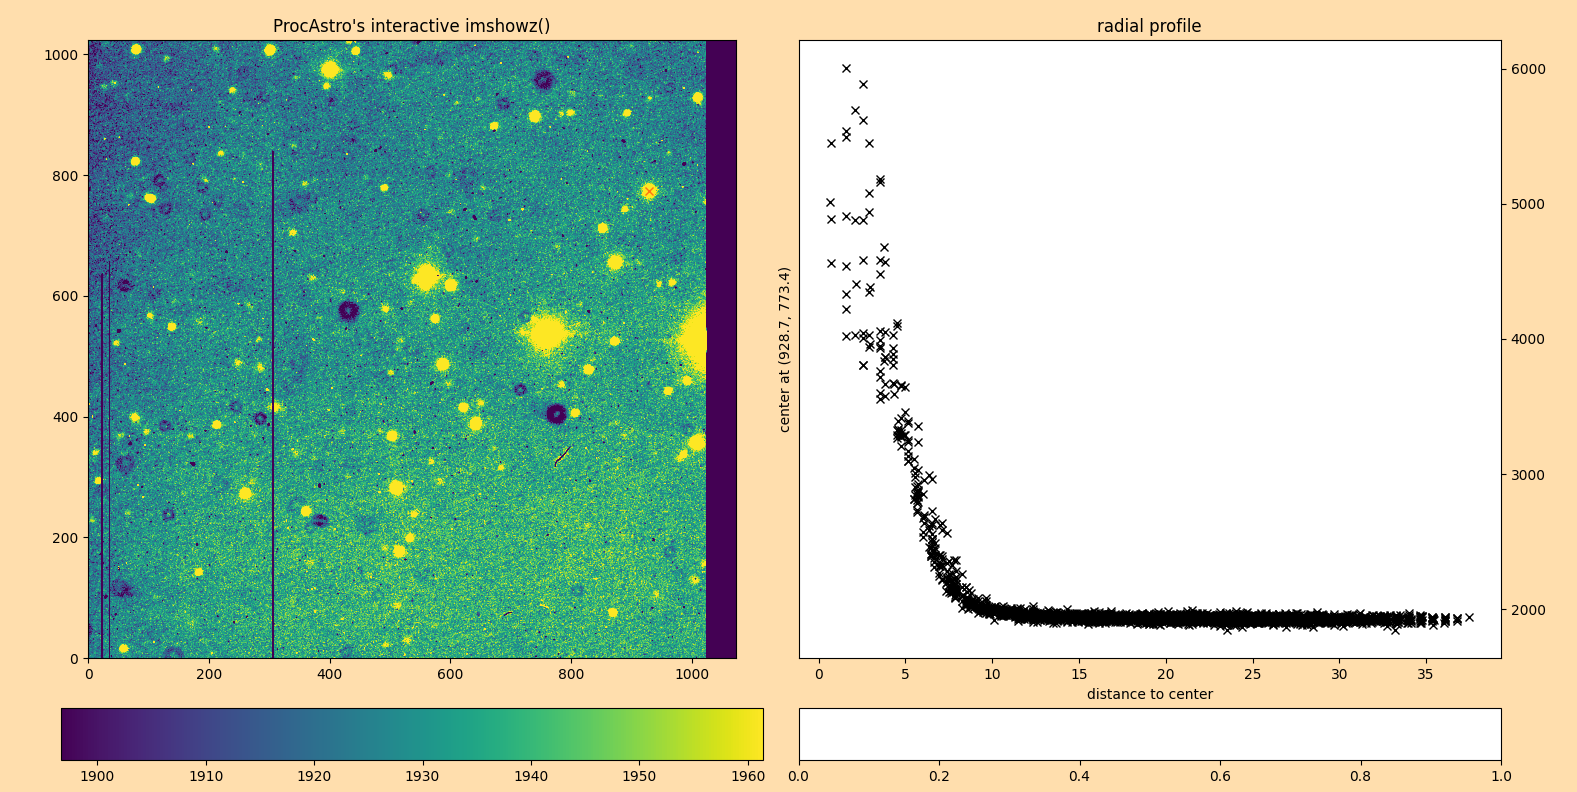
The function imshowz() can be used as method to an AstroFile or passed a filename/AstroFile/array and it will plot the 2D image using zscale for contrast
pa.AstroFile("file.fits").imshowz()
pa.imshowz("file.fits")
pa.imshowz(np.array(np.random.randint(1, 100, size=(400,500))))
Further, if you use interactive=True, a very versatile interactive tool becomes available. It will remind you of ds9/imexam but is Python native!
pa.imshowz("file.fits", interactive=True)